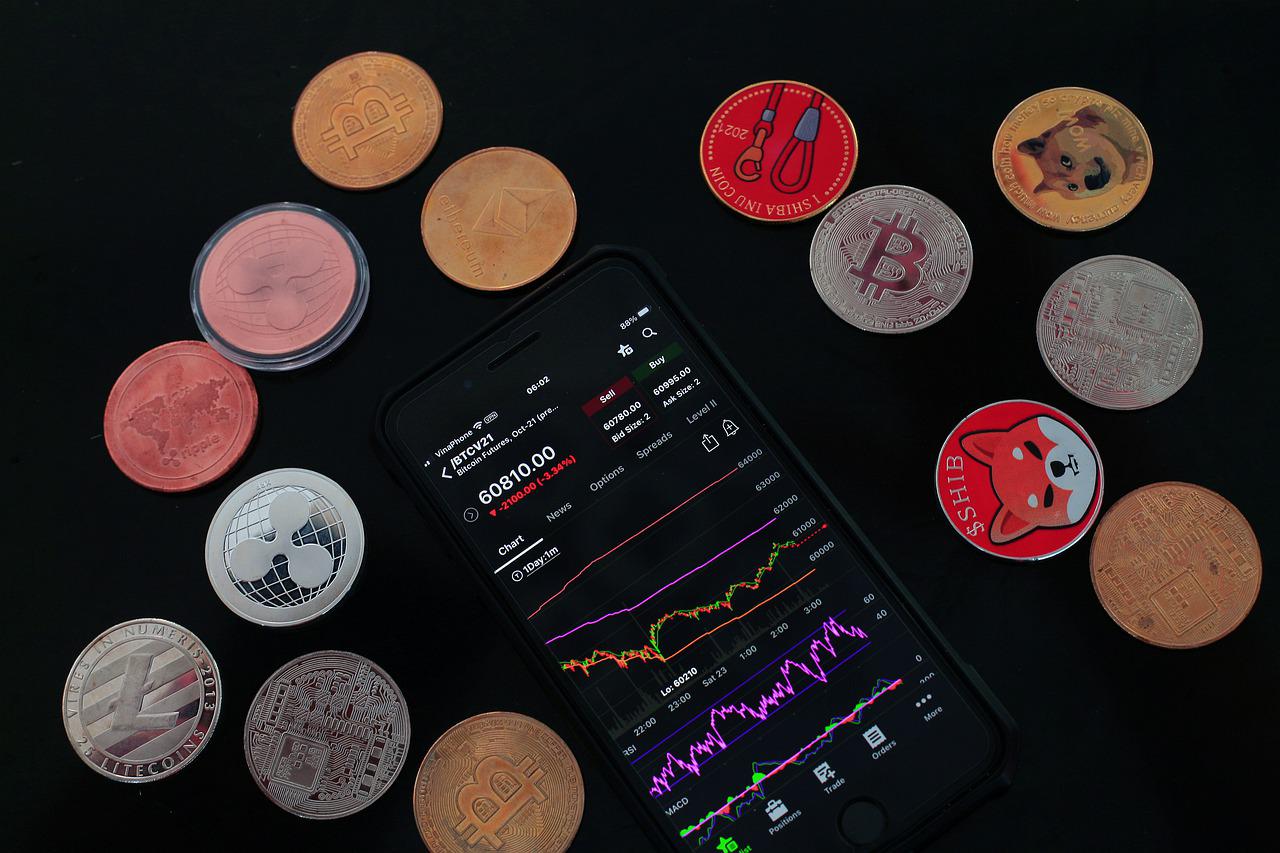
The profitability of trading on exchanges depends on the ability to predict the dynamics of coin rates. Experts told what indicators are used in trading cryptocurrency
Regardless of the strategy chosen by the user, work on the stock exchange always follows the general algorithm: before opening a transaction, the trader evaluates the probability of a reversal or continuation of the trend, determines the moment of entry, and only then places an order.
The result of the work depends on the accuracy of market research before trading. It is necessary to understand how the exchange rate will change. In addition to fundamental analysis, which includes the study of political and economic news, a trader conducts technical analysis.
It is based on the study of the history of cryptocurrency quotes. It is believed that the dynamics of the exchange rate is cyclical, and the growth and fall in demand naturally repeat.
Indicators or special mathematical formulas help a trader to predict price movements. All key indicators are calculated automatically on the trading platform. For the convenience of traders, they are located directly on the course chart or next to it.
What indicators and signals should be paid attention to first of all?
Currently, along with the development of the financial sector, the number of instruments is growing, including for the crypto market, says Artem Deev, head of the analytical department at AMarkets. In his opinion, it is better for any trader, regardless of the level of professionalism, to start and constantly use the following classic tools:
- Sales volume (volume)
Volume reflects the level of investor interest in the market, shows the number of transactions for a certain period of time. The Volume chart contains green and red “candles”: the former indicate a decrease in the market volume, the latter indicate its increase. By analyzing the Volume indicator together with the price chart, you can confirm the trend or refute it, and predict a sharp price change: when the price chart goes up and the Volume increases, this is a bullish market signal, an increase in Volume when the price drops indicates a bearish market.
- Moving averages
Moving average (MA) analyzes the average price for a certain period. The MA chart is superimposed on the chart of the current price movement, which gives a relative idea of the price trend. If the current price of a cryptocurrency stays above the moving average for a long time, we can assume its further growth. If the real price lies below the moving average, this is a signal to reduce it.
- Exponential Moving Averages
EMA is a type of moving average that prioritizes the most recent data, which helps to know the direction of the trend more accurately. That is, it helps to predict for the medium term.
- Moving Average Convergence Divergence (MACD)
MACD is a moving average convergence-divergence indicator. A positive MACD indicates an uptrend. The tendency of the curve to the upper signal line means a good time to buy, called a bullish crossover. A negative MACD indicates a downtrend.
- Relative Strength Index (RSI)
The relative strength index shows whether the market is overbought or oversold. It indicates the weakness or strength of a cryptocurrency through the previous change in its price. These changes indicate whether the asset has been overbought or oversold.
- Fibonacci levels
Fibonacci levels help predict entry and exit points, tell the trader the moments to sell or buy an asset.
From simple tools to professional
It is necessary to understand the indicators and understand what they show and what trading signals they generate. After that, all indicators will become easy for the trader, BitRiver financial analyst Vladislav Antonov is sure. According to him, the trader first sorts through all the indicators he likes, selects three of them, on the basis of which the trading system is written.
The analyst advises not to use more than three indicators, as conflicting signals will not allow you to enter the market. He explains that the simpler the system, the more profitable it is.
“It’s a good idea to start learning volumetric and cluster analysis right away. Indicators are good, but without volumetric analysis it is impossible to see the balance between supply and demand,” Antonov added.
To analyze the market, you can use the display of the chart in the form of tic-tac-toe, or in clusters, the expert says. He explained that it is possible to build price bars by volume.
“There are many tools. You can choose according to your taste and color, ”concluded Antonov.
Traders often rely on moving averages, said Andrey Podolyan, CEO of the Cryptorg platform. The expert also noted indicators such as RSI, MACD, which can be used to determine overbought/oversold levels, and divergence and convergence indicators, which indicate market instability and the end of a trend.
“Volume indicators are also very important, top traders trade through specialized terminals, where the main attention is drawn to the volumes entering / exiting the coin,” the expert added.
Podolyan mentioned that there are many self-written indicators. He explained that the trading terminals of exchanges and brokers are now tightly integrated with the TradingView service (trading tool), so anything can be displayed on the chart.
Stock market influence
The same market principles work on top coins with high liquidity as on the stock/currency market, says Andrey Podolyan, CEO of the Cryptorg platform. He said that many traders working in the standard markets are already actively trading cryptocurrencies and, accordingly, apply the same rules.
“Cryptocurrency has a close relationship with the stock market, so you can apply the same methods of technical and graphical analysis,” BitRiver financial analyst Vladislav Antonov agreed with him.
According to the specialist, intermarket analysis is necessary for cryptocurrency trading, as an integrated approach is needed.
“Now the cryptocurrency has a close relationship with the stock market, so the dynamics of stock indices plays an important role in determining the external background for risky assets,” the expert concluded.


